Quarterly OLED and Mobile/IT LCD Fab Utilization Report
Report Summary
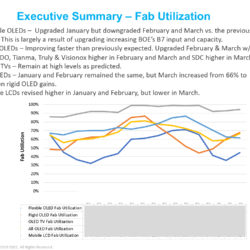
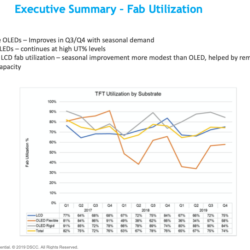
With a number of equipment and materials suppliers’ financial results dictated by panel suppliers’ fab utilization, we developed this service to help companies, industry analysts and financial analysts assess the impact of OLED and mobile LCD suppliers’ fab utilization on company performance and the industry outlook.
-
Pages
21 -
File Format
Excel Pivot Tables and PDF Summary -
Published
Quarterly -
Order Report
With a number of equipment and materials suppliers’ financial results dictated by panel suppliers’ fab utilization, we developed this service to help companies, industry analysts and financial analysts assess the impact of OLED and mobile LCD suppliers’ fab utilization on company performance and the industry outlook.
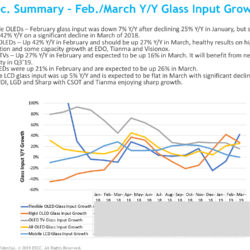
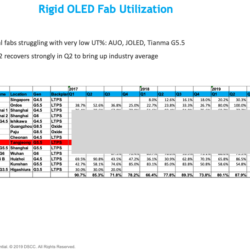
For every OLED and LTPS LCD mobile fab, we reveal their capacity and glass input by month. This information is provided by month and forecasted forward one quarter. There is one update per quarter.
The capacity and utilization data is provided through a series of pivot tables covering glass capacity and input in sheets and area.
- Capacity – sheets and area
- Input – sheets and area
- Utilization – sheets and area
The utilization data can be segmented by:
- Supplier
- Country
- TFT Generation
- Backplane
- Frontplane
- Substrate type – rigid vs. flexible vs. foldable
In addition to the pivot tables, analysis is provided through PPT slides.
Areas Covered:
- Capacity, glass input and fab utilization by month for:
- Mobile OLEDs
- Mobile LCDs
- Previous/current months results + 1 quarter forward forecast
- Sortable by:
- Supplier
- Country
- TFT Generation
- Backplane
- Frontplane
- Form Factor
- Technology
- Fab Generations Covered:
- 3.5, 4.5, 5.5, 6 and 8.5
Table of Contents
1. Methodology p.4
2. Mobile/IT Display Fab Utilization, Input Area, Capacity, Y/Y Growth p.5
- By Technology/Substrate
- By Manufacturer
3. Utilization by Fab p.17
4. OLED TV Utilization, Input Area p.20


