Quarterly Display Glass Report
Report Summary
This report tracks glass capacity and shipments for all major glass makers across all LCD and OLED display fabs. The report combines Counterpoint’s comprehensive insight into industry capacity and utilization with in-depth understanding of display glass and the supply chain.
-
Pages
45 -
File Format
PDF + Excel -
Published
Quarterly -
Order Report
Glass substrates form the starting point for production of all flat-panel displays, and glass supply is critical to the display industry. Even for flexible and foldable OLED displays, glass substrates are used as carriers for a polyimide layer for the display, because of the superior thermal stability characteristics of this versatile material.
This report tracks glass capacity and shipments for all major glass makers across all LCD and OLED display fabs. The report combines Counterpoint's comprehensive insight into industry capacity and utilization with in-depth understanding of display glass and the supply chain.
Areas Covered:
- Display Glass Capacity Regions: Japan, China, Korea, Taiwan
- Display Glass Shipment Regions: Japan, China, Korea, Taiwan, Singapore
- Gen Sizes from Gen 1 to Gen 10.5
- Glassmakers: AGC, Corning, NEG, Others
- Supply Matrix to 26 panel makers
Report Deliverables Include:
- Mother Glass Capacity by Region
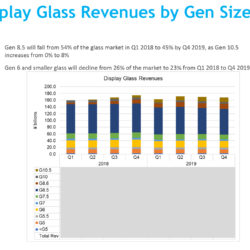
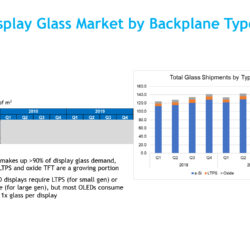
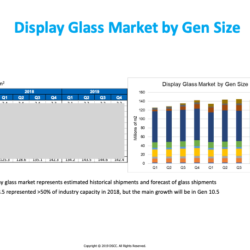
- Display Glass Market by Quarter, segmented by:
- Panel supplier
- Gen Size
- Region of destination shipment
- Backplane Type (a-Si, LTPS, oxide)
- Display Technology (LCD, OLED)
- Display Glass Market Supply Chain
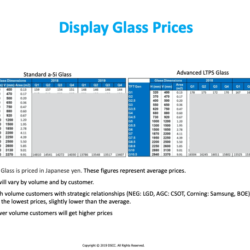
- Display Glass Prices by backplane type and Gen Size
- Profile of Glass Manufacturers
Optional Capacity and Utilization Module
An optional add-on to the glass report will cover Counterpoint’s capacity and utilization database. Delivered in an Excel worksheet with pivot tables, the Capacity and Utilization Module will cover all the segmentations described above with TFT input capacity and utilization by quarter with history starting from 1Q 2018 and a forecast including the current year.
Table of Contents
Executive Summary 4
Methodology 6
Display Glass Markets 8
- Mother Glass Capacity by Region
- Market by Gen size
- Market by Region
- Market by Backplane Type
- Market by Glass Maker
- Display Glass Market Supply Chain
- Display Glass Prices
- Display Glass Revenues
Display Glass Manufacturers: 29
Appendix: 43


