DSCC
info@displaysupplychain.com
FOR IMMEDIATE RELEASE: 10/23/2023
Fab Utilization Cooling in Q4’23 to Avoid Oversupply
La Jolla, CA -
The increase in display fab utilization that started in Q1’23 accelerated in the second and third quarters but has come to an end and utilization is declining in the fourth quarter, according to the latest release of DSCC’s Quarterly All Display Fab Utilization Report issued last week. According to DSCC Principal Analyst and CFO Bob O'Brien, "The big increases in utilization by LCD makers have stocked the display supply chain with sufficient product for the holiday selling season, and panel makers are tapping the breaks in an effort to make a “soft landing” and avoid an oversupply."
The report details monthly capacity, TFT input and utilization for every flat panel display fab in the industry, more than 100 fabs in all, and includes pivot tables to allow segmentation by supplier, country, TFT fab generation, backplane, frontplane or substrate type. The report provides historical utilization back to Q1’19 and a forecast by month for the full year 2023. Subscribers to the report can see the forecast for the first quarter of 2024.
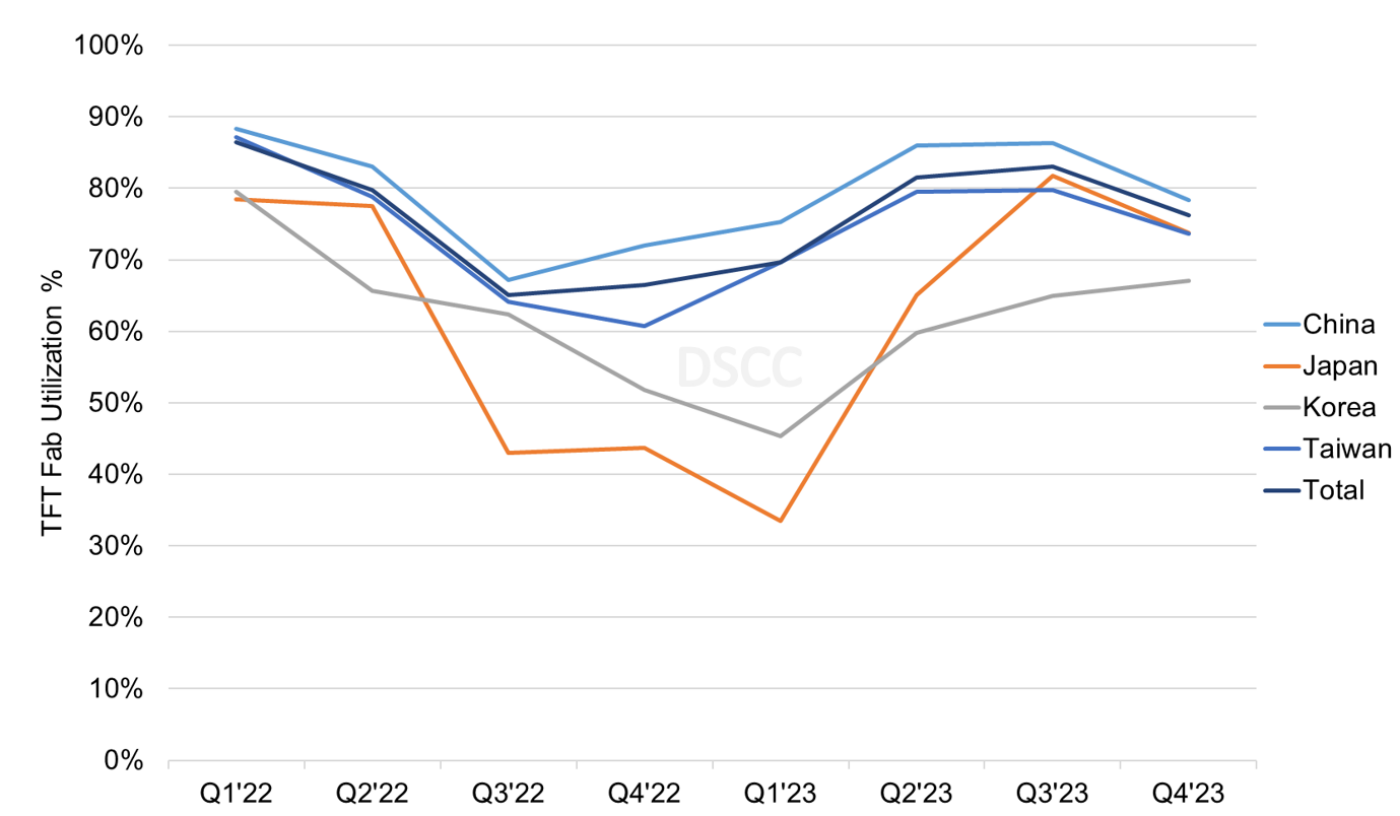
Fed by the pandemic demand surge, fab utilization was particularly strong in Taiwan and China in 2021 and through Q1’22, as shown in the first chart here. Meanwhile macroeconomic and geopolitical shocks caused demand to plunge. Utilization fell 6% in Q2’22 and another 15% in Q3’22 to 65%, the lowest point since the financial crisis of 2008-2009. Chinese panel makers started to recover in Q4’22 while Taiwan panel makers hit bottom. Taiwan panel makers started to recover in Q1’23 while Korean panel makers hit bottom.
All regions increased utilization in Q2’23 and worldwide UT% jumped up to 81%. Utilization edged up further in Q3’23 to 83% as utilization in China and Taiwan was flat sequentially but UT% increased in Korea and Japan. DSCC now expects that all regions except Korea will slow down utilization in the fourth quarter and worldwide UT% will decrease to 76%.
TFT Quarterly Fab Utilization by Region, 2022-2023
The slowdown affected OLED production as well as LCD but was more severe and persisted longer for OLED lines. Korea has a dramatically higher share of its capacity as OLED, while all other regions are dominated by LCD. With the shutdown of SDC’s T8 fab and LGD’s P5 and P7 fabs in 2022, in Q4’23, 59% of Korea capacity produces OLED panels, while the percentage of OLED in China is only 6% and it is negligible in all other regions.
The downturn for LCD fabs had a common cause – the sharp reduction in LCD panel prices and the inventory build-up. Although LCD capacity is not completely interchangeable, it is largely fungible, so a shortage in one gen size of capacity can be made up with another gen size, and similarly an oversupply in one area spills over onto other areas. OLED capacity is different in that there are five distinct classes of OLED capacity with little overlap between them:
- White OLED capacity for LGD, on Gen 8.5 lines with oxide TFT backplanes for OLED TV and monitor panels;
- QD-OLED capacity for SDC, also on Gen 8.5 lines with oxide TFT backplanes for OLED TV and monitor panels;
- Rigid OLED capacity, mostly for SDC but a few others, on Gen 5.5 and smaller lines with LTPS backplanes for smartphone, tablet and notebook panels;
- RGB OLED capacity on rigid substrates with thin film encapsulation (Rigid + TFE) on LGD’s E7 line in Paju, for IT applications;
- Flexible OLED capacity for many suppliers, primarily on Gen 6 lines with LTPS or LTPO backplanes for smartphone panels.
While the causes for the downturn vary for each class of capacity, they all share one factor – the slowdown of demand in electronic devices.
Looking more closely at LCD, a view of utilization by manufacturer by month shows the dramatic recovery in Q2 and Q3’22 for each of the top seven LCD makers, which have a combined 87% of the industry’s LCD input by area. It is also clear that all seven of these panel makers will slow down in the fourth quarter.
The chart also shows that while all companies are recovering from the downturn, some are recovering faster than others. The companies with the deepest downturn and slowest recovery have been AUO and Sharp. AUO apparently made the decision to hold the line on prices and turn away business rather than competing for sales below cost. With LCD TV panel prices increasing in Q2’23, AUO was able to increase its utilization and the company went further in Q3’23 with utilization reaching 82.5%, the highest level since Q1’22.
TFT LCD Monthly Fab Utilization by Manufacturer, 2022-2023
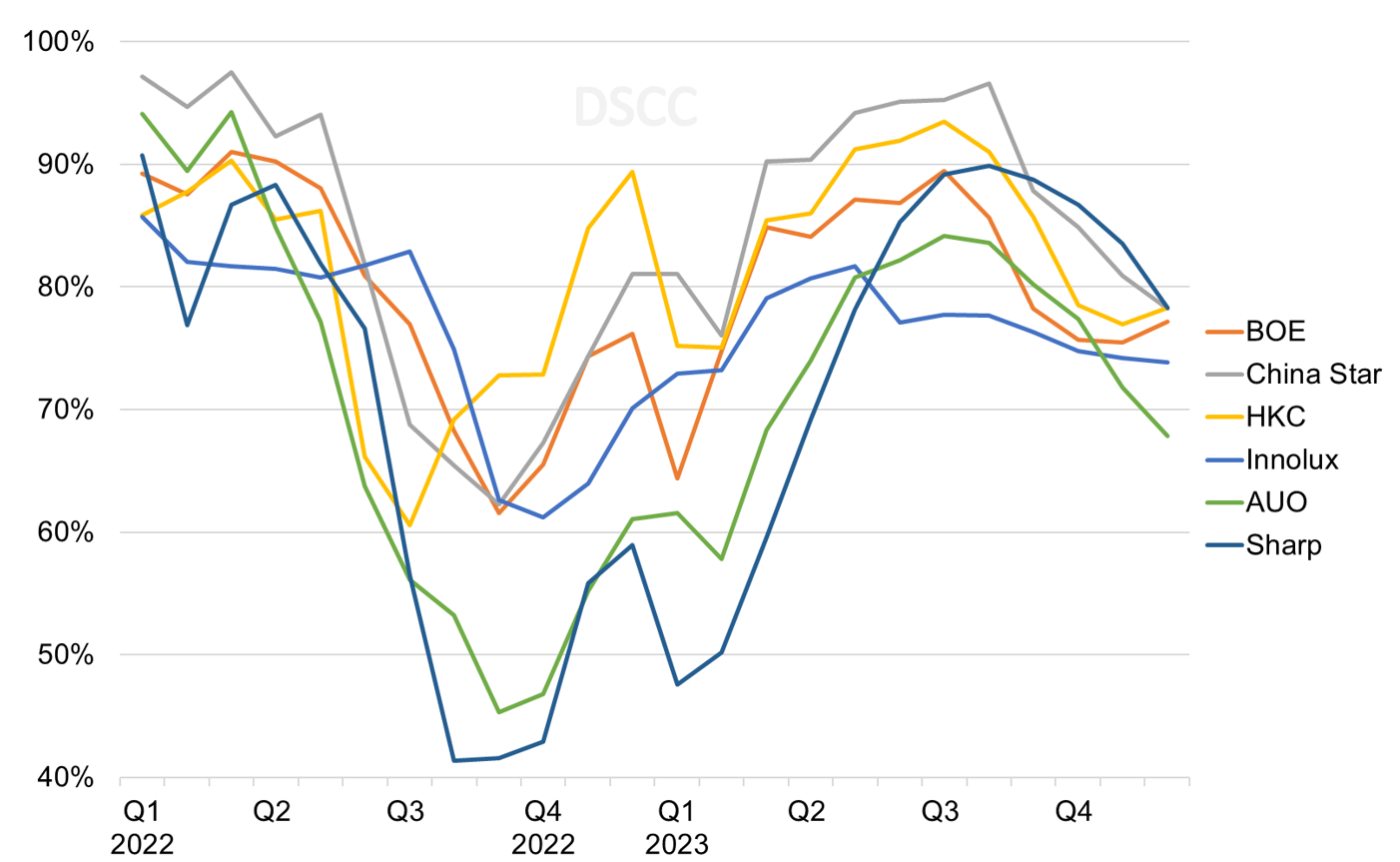
Like AUO, Sharp saw its utilization plummet in the second half of 2022, and lags behind the Chinese panel makers in 2023. Sharp’s capacity is dominated by its two G10+ lines, the original Gen 10 fab in Sakai City, Japan and the more recent Gen 10.5 fab in Guangzhou, China. The Sakai fab struggled through three quarters of extremely low utilization from Q3’22 through Q1’23, with UT under 30% for nine months. Utilization at the Sakai fab jumped to 70% in Q2’23 and to 94% in Q3. DSCC expects Sakai utilization to slow to 80% in Q4.
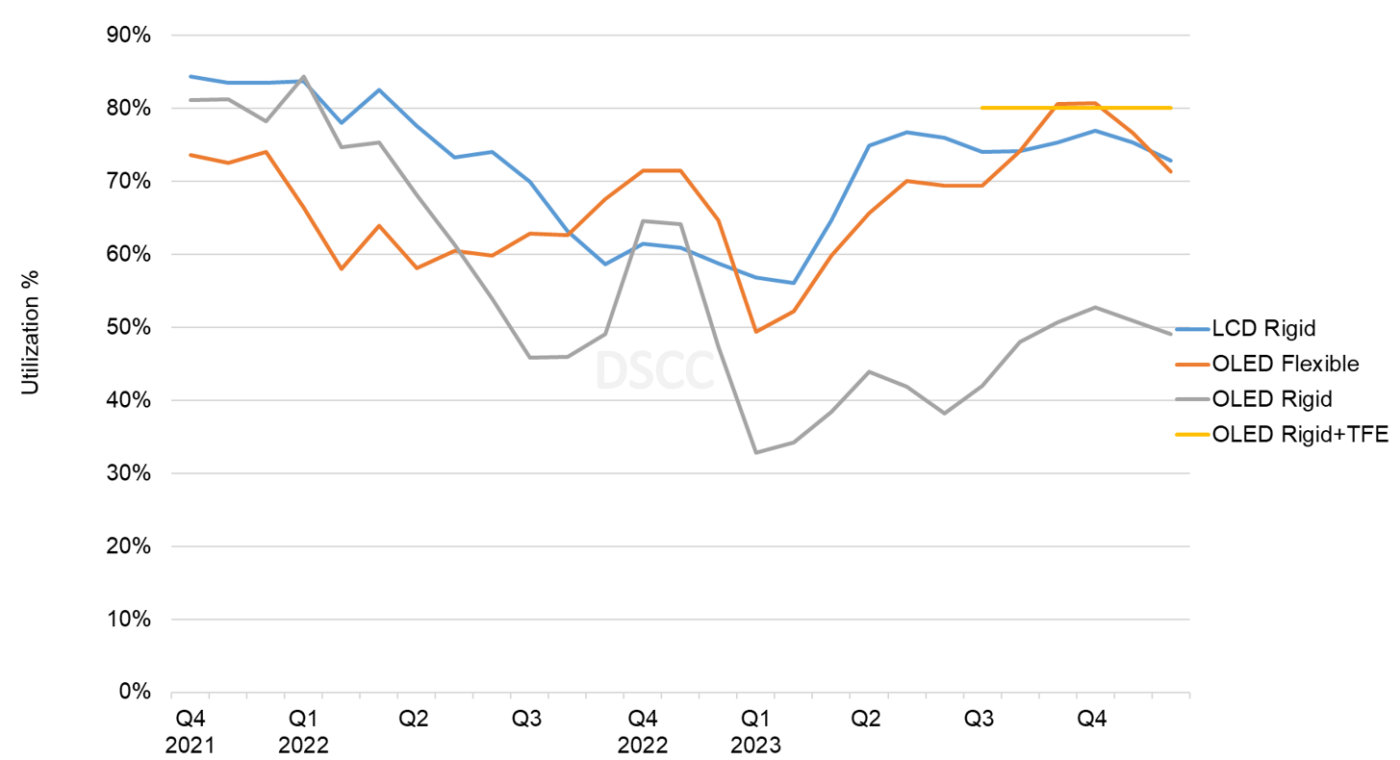
The Quarterly All Display Fab Utilization Report, as its name implies, covers every display technology and application, but a separate DSCC report, the Quarterly OLED and Mobile/IT Fab Utilization Report, also updated last week, provides a more narrow focus on OLED and LTPS LCD. The next chart here shows a view of utilization for LTPS LCD and OLED with Rigid and Flexible substrates. As compared to the larger-screen categories, where the downturn bottomed out in Q3/Q4’22, the slowdown in the Mobile IT sector hit bottom in Q1’23. Rigid OLED continues to have low UT% because of weak demand for rigid OLED panels for smartphones amid intense competition with Chinese flexible OLED panels. While flexible OLED and LTPS LCD have recovered from earlier this year, both formats struggle with overcapacity, especially in China, so they will rarely exceed 80% utilization. Like the general FPD market, DSCC expects utilization in all of these mobile formats to decline in Q4’23.
Quarterly TFT Utilization by Display Technology and Substrate, 2021-2023
After suffering its worst downturn in more than a decade, the display industry started to recover in the two middle quarters of 2023. However, total industry capacity continues to far outstrip demand for displays, and the industry’s push for higher utilization risks shifting the supply/demand balance into oversupply. It appears panel makers are aware of that risk and taking steps in Q4’23 to mitigate the risk and try for a “soft landing”.
DSCC’s Quarterly All Display Fab Utilization Report covers capacity, TFT Input and utilization by month for every flat panel display fab in the industry, with pivot tables to allow segmentation by supplier, country, TFT fab generation, backplane, frontplane or substrate type. The report provides historical utilization back to Q1’19 and a forecast by month for the full year 2023. DSCC Weekly readers interested in subscribing to the Quarterly All Display Fab Utilization Report should contact info@displaysupplychain.com.
About Counterpoint
Counterpoint Research acquired DSCC (Display Supply Chain Consultants) in 2023, joining forces to become the premier source of display industry research globally. The partnership combines Counterpoint’s thought leadership and expertise across the broader tech sector and DSCC’s deep specialization in display technologies to provide an unparalleled resource for insights and analysis for our clients.